I have been using interdisciplinary approaches to solve interesting questions in cellular signaling. I combined mathematical analysis and computation to investigate dynamics in somitogenesis and population movement. I also used modeling and computation to clarify controversial issues in immunotherapy. Next, I moved to a wet lab to learn experimental skills in fluorescence microscopy, physiology, and genetic engineering of plant cells. I combined computation and experiment to overcome technological limitations and improve experimental setting.
I. Somite formation of zebrafish (Use Delay Differential Equations)
II. G protein signaling pathway in plant cells (Use Ordinary Differential Equations)
III. Modeling in cancer immunotherapy (Use Partial Differential Equations)
Part I: The controversial role of CD200-CD200R in tumor microenvironment
Part II: The functions of Interleukin-27 (IL-27) and Interleukin-35 (IL-35) in tumor microenvironment
Part III: How anti-PD-L1 drug improves cancer treatment efficacy?
IV. Mathematical modeling and analysis of Covid-19 treatment.
V. Evolution in ecology (Use Patch model)
VI. SnapBack repeller (Use Dynamics system)
(Dr. Kang-Ling Liao holds the copyright over all figures and diagrams in this page)
I. Somite Formation of Zebrafish
My main work is to build mathematical models to capture the dynamics of gene expressions during somite development process (Video 1). In order words, our models can capture the dynamics of the fluorescence shown in Video. 2. We use these mathematical models to study how these gene expression affect the cell fate and pattern formation in zebrafish.
Video 1. Fluorescence of gene expression in somite formation [link: https://www.youtube.com/watch?v=TXRJW44vjMc]
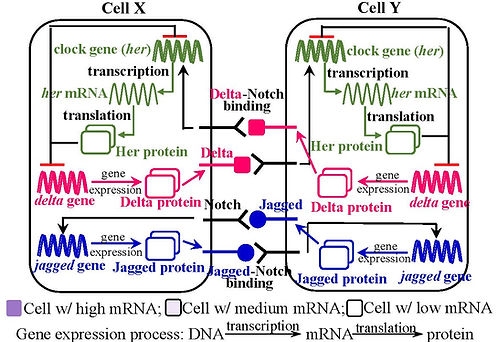
Segmentation is the process by which cells differentiate into segmental structures during body development. In vertebrates, this process generates somites which form critical segmental tissues such as the vertebrae, ribs, and body wall muscles. Somites form rhythmically from the embryo tail, called the Presomitic Mesoderm (PSM). This rhythmic pattern is guided by the cyclic wave of expression of clock genes, which are downstream targets of Notch signaling. Cells are coupled when the membrane-bound Notch receptor in one cell interacts with the Delta or Jagged receptor ligand of an adjacent cell. In the coupled cells, Delta-Notch or Jagged-Notch binding transmits signals and triggers the expression of the clock gene, the process through which DNA of the clock gene generates its mRNA and protein. The entire process is named Notch signaling.
Fig 1. Notch signaling within two coupled cells
During somite formation, the formation of each segment is coincident with a repetitive wave of gene expression in the PSM. Cells in the posterior PSM produce clock gene expression in synchronous oscillations. The oscillation has a defined period and generates traveling waves that pass anteriorly to where the new somite forms. Upon the anterior PSM, the oscillation stops; the high level of gene expression at the end of the oscillation polarizes the somite with the cells at the front taking an anterior fate. This process is called somite polarity. During this phase, a demarcation between the anterior of the newly formed somite and the posterior of the previous somite is established, called the somite boundary
Experimentalists hypothesized that Notch signaling dominates the phenomena occurring in PSM, but it remains experimentally difficult to clarify the mechanisms through which Notch signaling orchestrates these phenomena. Thus, exploring the fundamental mechanisms of signal transmission and pattern formation in segmentation requires further investigation of Notch signaling.
Current Research
I am looking for students interested in working on the following objective via using mathematical modeling and analysis. Programming skills are needed. Collaboration with my wet lab in the Department of Biological Sciences and experimental collaborators is possible.
Objective 1. Build models to investigate the dynamics of two coupled cells.
Objective 2. Investigate the relation between individual and collective cell behaviors.
Objective 3. Design a comprehensive model for Notch signaling in zebrafish.
Objective 4. Extend the results in zebrafish to other species, such as arthropods and nematodes.
[Ref]: Kang-Ling Liao, Chih-Wen Shih, and Jui-Pin Tseng, 2012, Synchronized oscillations for a mathematical model of segmentation in zebrafish, Nonlinearity, No. 25, 869-904.
[Ref]: Kang-Ling Liao and Chih-Wen Shih, 2012, A lattice model on somitogenesis of zebrafish, Discrete and Continuous Dynamical Systems - Series B, No. 17, 2789-2814.
[Ref]: Kuan-Wei Chen, Kang-Ling Liao and Chih-Wen Shih, 2017, The kinetics in mathematical models on segmentation clock genes in zebrafish, Journal of Mathematical Biology, No. 25, 1-54.
II. G Protein Signaling Pathway in Plant Cells
Introduction of G protein structure
Video 3: G protein coupled receptor [link: https://www.youtube.com/watch?v=Glu_T6DQuLU]
G protein cycle in animals
G proteins are important signal-transducing molecules in cells. In animal systems, G proteins are comprised of Gα, Gβ, and Gγ-subunits.
i) Without ligand-bound receptor (GPCR: G protein coupled receptor),
a) the G alpha-subunit keeps its GDP tightly bound to form an inactive heterotrimer with the Gβγ-subunits.
ii) In the presence of ligand-bound receptor GPCR,
b) GDP dissociates from Gα, and then GTP immediately binds with G alpha to form an active GTP-bound state.
c) This active Gα-subunit dissociates from Gβγ and then regulates the activity of its effectors.
d) The active Gα-subunit immediately returns to the inactive state by hydrolysis of the bound GTP, which means that the GTP releases phosphoric acid to form the GDP again.
Thus, the G protein in animals prefers to stay at inactive state
For more inforamyion, see [D. Urano et al, 2013, Open Biology 3, 120186; D. Urano et al, 2012, Nature Cell Biology, 14, 10];
G protein cycle in plants (Arabidopsis)
In plant cells, G proteins have structural similarities to the corresponding molecules in animals, but transmit signals by different mechanisms.
i) Without D-glucose stimulus, the structure of G alpha spontaneously fluctuates which initiates GDP dissociation and nucleotide exchange to form an active GTP-bound state. Meanwhile, a 7TM-RGS protein, AtRGS1, promotes GTP hydrolysis of the alpha-subunit to form an inactive GDP-bound state. Therefore, the state of G protein keeps
switching between inactive and active states rapidly.
ii) Under D-glucose stimulus,
a) D-glucose inhibits the GTP hydrolysis by trigging AtGRS1 endocytosis.
This means that glucose keeps Gα-GTP bound with RGS and then releases the Gβγ.
b) The released Gβγ recruits WNK kinases to phosphorylate AtRGS1.
c) The phosphorylated AtRGS1 then undergoes endocytosis, which causes uncoupling of Gα from AtRGS1.
Different from animals, this AtRGS1 endocytosis keeps G-protein stay at the active state to regulate its effectors
For more information, see [D. Urano et al, 2013, Open Biology 3, 120186; D. Urano et al, 2012, Nature Cell Biology, 14, 10];
In plant cells, there are many signaling pathways that crosstalk through the regulator protein AtRGS1 to generate normal physiological mechanism, such as cell proliferation, pathogen defense, and sugar and salt sensing. This is why AtRGS1 is so important in plant cells. Understanding the dynamics of AtRGS1 can help us investigate the bottleneck paradox of how plant cells make the decision to choose different downstream pathways when they only go through a receptor AtRGS1. In addition, AtRGS1 endocytosis triggers G protein to activate downstream pathways, so the AtRGS1 endocytosis could be a critical indicator for bottleneck paradox. However, in vivo, techniques are unable to measure the amount of most components in G protein signaling, so it is difficult to explore the detailed mechanism of G protein signaling pathway in plant cells, experimentally. Therefore, I combine mathematical modeling and biological experiment to help overcome these problems.
My work is based on the following G protein network shown in [Y. Fu, et al., 2014 Cell, 156, 1084-1095]
Part 1: Find the shadow detector for photosynthesis efficiency
Plants are unable to escape their environment, so they are evolved cellular and chemical control mechanisms to deal with the variability of sunlight illumination. But, how do plants detect the intensity, duration, and change in light as they experience moving shadows, flickering light, and cloud cover and then adjust their physiology to avoid overheating?
To answer this question, I modified a model constructed by a former postdoc in our lab to investigate how light information affects the G protein system. My simulation and experimental results indicated that information about changes in the light is encoded in the amount of the AtRGS1 after endocytosis.
[Ref]: Kang-Ling Liao, Roger D. Jones, Patrick McCarter, Meral Tunc-Ozdemir, James A. Draper, Timothy C. Elston, David Kramer, and Alan M. Jones, 2017, A shadow detector for photosynthesis efficiency, Journal of Theoretical Biology, No. 414, 231-244.
Part 2: How gene expression level affect the cell behavior and signaling?
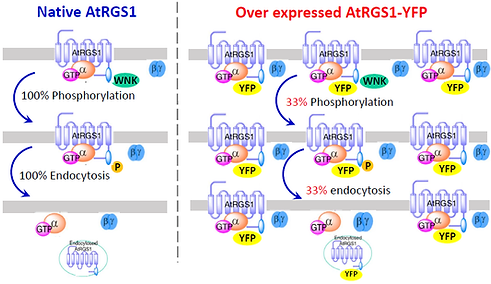
Another important question is whether the overexpression of one component alters cell signaling. For instance, in experiments, we fused YFP protein on AtRGS1 to generate fluorescing AtRGS1 protein, i.e., AtRGS1-YFP, and then over-expressed this protein by 35S promoter to visualize localization of AtRGS1 in seedling cells. We then used fluorescence confocal microscopy to capture the dynamics of AtRGS1 under D-glucose treatments. However, this over-expression dramatically changed the amount of AtRGS1 which potentially altered the ratio of AtRGS1 to other key components, such as kinases, and hence altered cell behaviors.
Fig 3. Over expression of AtRGS1-YFP could reduce the phosphorylation rate
In (Liao et al. 2017 PLoS One), I used an ODE model to prove a hypothesis that the total AtRGS1 level affects AtRGS1 endocytosis. Our in silico and in vivo results detected a threshold of AtRGS1 amount of normal cell behavior. This work is a useful tool for plant experimentalists, since our method can be used to select seedlings with a reasonable ARGS-YFP amount that will not alter the normal cell behavior to ensure the accuracy of experiments.
[Ref]: Kang-Ling Liao, Charles E. Melvin, Rosangela Sozzani, Roger D. Jones, Timothy C. Elston, and Alan M. Jones, 2017,
Dose-duration reciprocity for G protein activation: modulation of kinase to substrate ratio alters cell signaling, PLoS ONE, No. 12(12), e0190000.
Current Research
I am looking for students interested in working on the following objective via using mathematical modeling and biological experiments. Collaboration with my wet lab in the Department of Biological Sciences and experimental collaborators is possible.
Objective 1. Investigate the crosstalk through a single receptor AtRGS1.
Objective 2. Investigate the Extra-large G proteins (XLGs) in stress and immune responses in plant cells.
III. Modeling in Cancer Immunotherapy
Cancer immunotherapy is becoming increasingly popular in cancer treatment. The main idea of immunotherapy is to activate immune cells and get them to recognize and kill cancer cells again. This is unlike radiotherapy and chemotherapy that kill tumor cells directly. In the last few years, there are many promising developments in cancer immunotherapy. However, we still need to find better ways to judge the success, long term benefits, and remission of the immunotherapy and to work out the optimal dosage and treatment schedule. Therefore, my research will focus on combining mathematical modeling, analysis, and experiment to help overcome these problems.
Introduction video of cancer immunotherapy
Video 4: PD-1 and PD-L1 in cancer immunotherapy [link: https://www.youtube.com/watch?v=aobxYfY-8p0]
Video 5: Cancer immunotherapy [link: https://www.youtube.com/watch?v=dVn9zEYiKM4]
Part 1. The controversial role of CD200-CD200R in tumor microenvironment
Tumor cells express a protein, called CD200, on their cell membranes. When this protein binds to its receptor, CD200R, on macrophages, tumor cells can use this complex to silence macrophages, which means that inhibits its cellular functions and cytokine productions.
For more information, see [T.P. Rygiel et al. 2012, Oncogene 24, 2979-2988.]
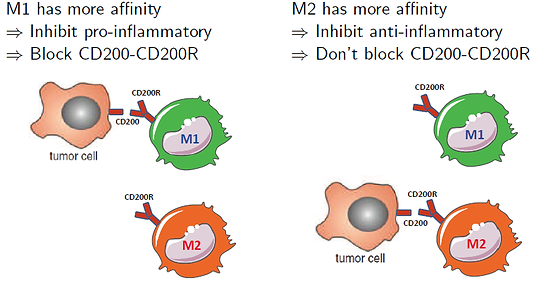
It seems that tumor cells use this complex to turn off macrophages, in order to avoid immune responses, so we should block it during cancer treatment. However, we have two types of macrophages, M1 and M2. Both of them are polarized from monocytes, but their functions in immune responses are very different. M1 cells mainly produce pro-inflammatory cytokines, such as IL-12, to inhibit tumor growth, but M2 cells produce anti-inflammatory cytokines, such as IL10, which promotes tumor growth. Hence, whether CD200 complex always promotes tumor growth is unclear.
In experiments, we have two contradictory experimental results. Most experiments show that the CD200-complex promotes tumor growth, like this experiment in papilloma. They considered two cases. In wild type mice, the tumor cells normally express CD200, and in CD200-deficient mice, tumor cells lose the ability to express CD200. Their results show that although both mice developed papilloma, CD200-deficent mice developed three to four times less papillomas than the wide type mice. This result indicates that expressing CD200 promotes papilloma, so blocking CD200 treatment might be an effective approach to treat papilloma.
For more information, see [T.P. Rygiel et al. 2012, Oncogene 24, 2979-2988.]
However, other experiments show an opposite result, like this experiment in melanoma. Their result shows that if we block CD200 on tumor cells to get this CD200-negitave case, then it only increases tumor growth, which means that CD200-complex suppresses melanoma.
For more information, see [F. Talebian et al., 2012, PLoS One, 7, e31442 ]
Papilloma and melanoma are similar to each other, but the same treatment leads to opposite result. Therefore, whether CD200-CD200R promotes or inhibits tumor growth is still a controversial question. In this study, we constructed a PDE model to explain why these two contradictory experimental results can both take place depending on the affinity of M1 and M2 macrophages to form the complex CD200-CD200R with tumor.
Hypothesis: Different affinities of M1 and M2 causes the opposite results in tumor growth
Fig 4. Affinities of M1 and M2
Conclusion: We are the first group to clarify this issue, computationally. Our PDE model indicated that the controversy is caused by different binding affinities among macrophages. We also derived a threshold curve based on the binding affinities, so that clinicians can use this curve to determine a treatment method for CD200-CD200R in different types of cancers
Do we need to block CD200-CD200R during cancer treatment?
Fig 5. Our conclusion
[Ref]: Kang-Ling Liao, Xue-Feng Bai, and Avner Friedman, 2013, The role of CD200-CD200R in tumor immune evasion, Journal of Theoretical Biology, No. 328, 65-76.
Part 2. The functions of Interleukin-27 (IL-27) and Interleukin-35 (IL-35) in tumor microenvironment
Cytokine treatment: Cytokines are proteins produced by many types of cells to modulate immune responses. It can be separated into two groups: pro-inflammatory cytokines bring more immune cells to kill infected cells, and hence promote anti-tumor activities; whereas anti-inflammatory cytokines inhibit immune responses resulting in promotion of tumor growth.
Fig 6. Functions of cytokines
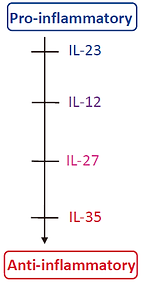
IL-12 cytokine family, which is frequently used in cancer treatment. In the IL-12 cytokine family, the most pro-inflammatory cytokines are IL-23 and IL-12, but both of them have toxic side-effects. Hence, recently, people have started to pay attention to another member, IL-27. IL-35 is the most recently identified member of IL-12 family. It suppresses T cell proliferation, converts naive T cells into regulatory T cells, enhances tumor associated myeloid cell accumulation, and promotes angiogenesis.
Fig 7. IL-12 cytokine family
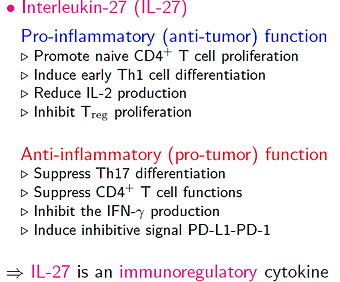
IL-27:
Our collaborator, Prof. Xue-Feng Bai, had some interesting experimental results indicated that, in melanoma, the tumor volume was dramatically suppressed by IL-27, since it increases CTLs and IL-10, even though IL-27 inhibits the IFN-gamma production. The question is whether we can get similar anti-tumor result if we use different IL-27 amount because different IL-27 amount may shift IL-27 from anti-tumor toward pro-tumor cytokine. To answer this question, we constructed a simplified mathematical model based on their experimental findings, and then use this model to compare different therapeutic protocols by using IL-27.
In our simulation results, when tumor cells secrete larger amount of IL-27, it induces higher T cells population and higher IL-10 production, resulting in lower tumor cell populations. These results qualitatively fit with the experimental data. Next, we modify this model to compare the efficacy of different therapeutic protocols by IL-27. Figure 18 shows the simulation results for no drug injection (red curve), intermittent (blue dashed curve), and continuous injections (black dashed-dotted curve). We withdraw the drug at the sixth month. Both treatments reduce tumor load during drug injection and relapse after the drug is withdrawn, but intermittent injections always relapse when the injection is suspended no matter how large the drug amount is, which could cause serious side-effects for patients. Hence, our results indicated that the sustained low dosage inhibited tumor growth effectively, avoided relapse, and reduced side-effects.
[Ref]: Kang-Ling Liao, Xue-Feng Bai, and Avner Friedman, 2014, Mathematical modeling of Interleukin-27 induction of anti-tumor
T cells response, PLoS ONE, No. 9(3), e91844.
IL-35:
Our collaborator Dr. Xue-Feng Bai has been working on transgenic mouse experiments to investigate the functions of IL-35 in tumor microenvironment. His experiments further indicate that IL-35 enhances tumor associated myeloid cell accumulation to suppress CTL response, and hence promotes tumor growth. Moreover, IL-35 promotes angiogenesis by increasing VEGF production. Based on their experimental finding (upper layer in Fig. 20), we constructed a mathematical model for IL-35 (Fig. 19) to capture its functions in tumor immunity and tumorigenesis (lower layer in Fig. 20). We then modified this model by including anti-IL-35 drug to compare the efficacy of different therapeutic protocols which may be used to make hypotheses for human cancer treatment.
[Ref]: Kang-Ling Liao, Xue-Feng Bai, and Avner Friedman, 2014, Mathematical modeling of Interleukin 35 promoting tumor growth and angiogenesis, PLoS ONE, No. 9(10), e110126.
Part 3. How anti-PD-L1 drug improves cancer treatment efficacy?
Programmed death ligand 1, PD-L1, is a cell surface protein expressed on cancer cells and immune cells. PD-L1 is a ligand for PD-1 and B7-1 expressed by activated immune cells. Think of PD-1 as a sensor that is part of the T cell scanning system, and B7-1 is like an alarm that issues an alert when something is wrong. When PD-L1 binds to PD-1 and B7-1 to form this complex, the complex transmits negative signal into the cells to prevent the activation of the T cells to destroy the cancer cells. However, if we use checkpoint inhibitor, such as antibodies anti-PD-1 and anti-PD-L1, to block this complex formation. Then these antibodies prevent PD-L1 from communicating with PD-1 and B7-1. When this happens, immune response is restored and T cells may finally respond by killing cancer cells.
The experimental result from our collaborator, Prof. Bai, demonstrated that a combination of anti-PD-L1 with IL-27 eradicated melanoma. However, whether IL-27 promotes or inhibits tumor growth is a controversial issue, since IL-27 enhances PD-L1-PD-1 formation. To clarify this issue, we constructed a free boundary PDE model to investigate the synergy analysis on these two drugs and found a threshold of IL-27 that distinguishes the behavior of IL-27. Thus, clinicians can use this threshold to determine combination dosages of IL-27 and anti-PD-1 to achieve optimal treatment results. We are the first group that experimentally (in vivo) and computationally (in silico) demonstrated the potent tumor reduction of the combination treatment by IL-27 and anti-PD-1, while others were still dealing with the pro-tumor functions of IL-27.
[Ref]: Kang-Ling Liao, Xue-Feng Bai, and Avner Friedman, 2018, Mathematical modeling of anti-PD-1 and IL-27 synergy in inhibiting tumor growth, in revision.
Current Research
I am looking for students interested in working on the following objective via using mathematical modeling and analysis.
Objective 1. Construct mathematical model for the combination therapy of anti-PD-1 and anti-CTLA-4 and design optimal treatment combination.
Objective 2. Construct mathematical model for the combination therapy of anti-PD-1, radiotherapy and chemotherapy and design optimal treatment combination.
IV. Mathematical modeling and analysis of Covid-19 treatment.
Coming soon!
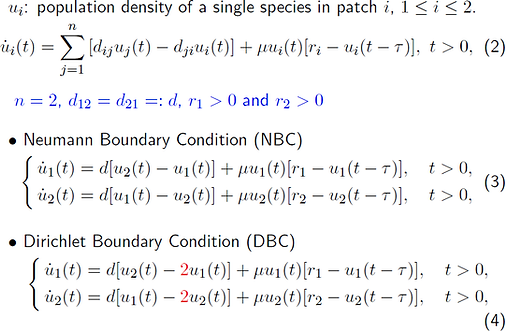
In ecology, oscillation of populations is an interesting phenomenon that may be caused by the seasonal change and food chain reactions. In this work, we consider another cause, time delay, to investigate how time delay generates abundant dynamics in ecology models.
A previous work showed that, for this PDE system for the population density under Neumann boundary condition, if the growth rate r(x) is a constant, then this system has a stable bifurcating orbit when delay, tau, is near this minimal bifurcation value. However, if the system is under Dirichlet boundary condition and mu is bigger than this bifurcation point mu^ast, then this system has a unique positive steady state. For Neumann and Dirichlet boundary conditions, there is very little work for non-constant growth rate r(x) case, due to the existence and uniqueness of the positive equilibrium. Hence, an interesting question is whether any analysis can be done on the values of mu far away from the bifurcation point mu^ast. To shed insight into these two systems, we studied similar questions for discrete-space and continuous-time patch models.
We considered a single species migrating between two habitats with irreducible and symmetric dispersal rates d, general growth rates r, and under these two boundary conditions.
Figure 8 is a summary of our results. Here, we used the monotone properties of the model to get the existence and uniqueness of positive equilibrium. We then applied delay Hopf bifurcation theorem, center manifold theorem, and the normal form method, to analyze the stability switch at each bifurcation point.
Fig 8. Dynamics of the patch model under different boundary conditions
When the growth rate r is a constant, for the systems with Neuman or Dirichlet BC, we found the region of the dispersal rate d to obtain a unique positive equilibrium u*. For each d, we further found the corresponded minimal bifurcation value tau_c such that the system generates stable periodic solutions when tau is close to tauc. Since there is no stability switching, this tau_c distinguishes the stability of the equilibrium. Hence, the species on both patches survive and tend to a steady state if the time delay is shorter than tau_c, but the dynamics of the species will be more abundant if the delay is longer than tau_c. Furthermore, we successfully released the condition on mu in the non-constant growth rate case. For both boundary conditions, we have similar results to the constant growth rate case, but we only have the no-stability switching result when d is within this green regions.
[For more information, please click here]
[Ref]: Kang-Ling Liao and Yuan Lou, 2013, The effect of time delay in a two-patch model with random dispersal, Bulletin of Mathematical Biology, No. 76, 335-376.
VI. SnapBack Repeller
1. How to modify Marotto’s Theorem?
2. Construct numerical method to detect the existence of snapback repeller
[For mation information, please click here!]
[Ref]: Kang-Ling Liao and Chih-Wen Shih, 2012, Snapback repellers and homoclinic orbits for multi-dimensional maps, Journal of Mathematical Analysis and Applications, No. 386, 387-400.
[Ref]: Kang-Ling Liao, Chih-Wen Shih, and Chi-Jer Yu, 2018, The snapback repellers for chaos in multi-dimensional maps, Journal of Computational Dynamics, accepted.
[Ref]: Kang-Ling Liao, Chih-Wen Shih, and Jui-Pin Tseng, Multidimensional dynamics: From simple to complicated, in Discrete Time Systems, Editor: Mario Alberto, Publisher: InTech, April 2011.